Communities that endure health and safety risks like high rates of violence, or unsafe air and water have a major impact on health and quality of life. Knowing that unsafe communities produce unhealthy residents is what made neighborhood and built environment a social determinant of health.
The four components of neighborhood and built environment are:
- Access to healthy foods
- Quality of housing
- Crime and violence
- Environmental conditions
According to Healthy People 2030, “Racial/ethical minorities and people with low incomes are more likely to live in places with these risks.”
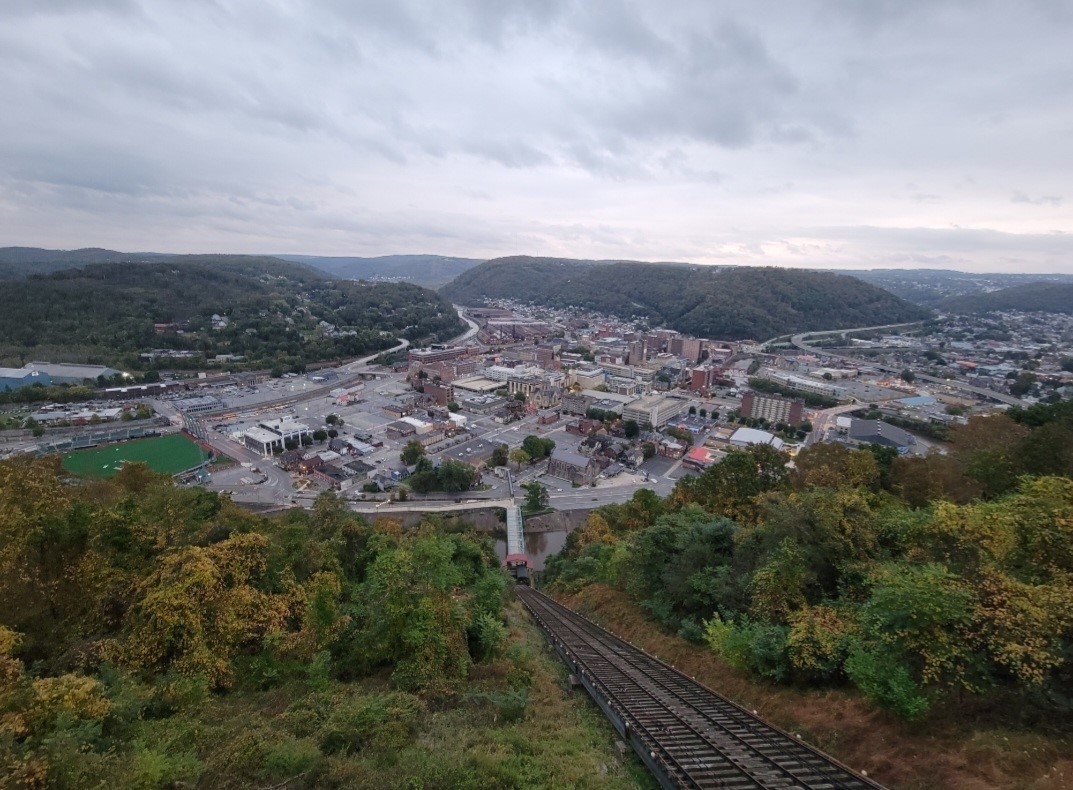
In an area like the City of Johnstown, which has a poverty rate of about 38%, the neighborhood and built environment play a large role for residents’ health.
Access to healthy foods isn’t a large problem in the city limits because there are grocery stores and a Farmers Market that runs from May to October; however, education on choosing healthy foods and how to use them to cook is a barrier people face.
Healthy food education is one goal the 1889 Jefferson Center for Population Health has moving forward into the New Year.
Quality of housing, or the physical condition of a person’s home, and the location of the home are also an indication of a person’s overall health. Low-income families are more likely to live in poor-quality housing that have higher rates of water leaks and poor air quality. These families also tend to live in unsafe areas that are affected by crime and violence, or component number 3.
Crime and violence is a major public health issue because individuals affected by it can lead to premature death or cause non-fatal injuries. Surviving after a violent crime injury can cause living with physical pain and mental distress.
The final component Environmental Conditions is caused by polluted air, contaminated water, and extreme heat.
The County Health Rankings program “provides data, evidence, guidance, and examples to build awareness of the multiple factors that influence health and support leaders in growing community power to improve health equity.” The Rankings compile health data for all counties in the United States.
In Cambria County and Somerset County air pollution was measured in 2018:
- Cambria County – 8.4 micrograms per cubic meter of fine articulate matter measured in the air
- Somerset County – 7.9 micrograms per cubic meter of fine articulate matter measured in the air
Cambria County has a higher rate of fine articulate matter than both Pennsylvania and the United States while Somerset County has a lower rate than Pennsylvania but higher than the Unites States.
- Pennsylvania – 8.3 micrograms per cubic meter of fine articulate matter measured in the air
- United States – 7.5 micrograms per cubic meter of fine articulate matter measured in the air
There have also been drinking water violations in both counties. A violation means that at least one community water system reported a health-based drinking water violation in 2020.
In order to combat these four components, policy changes and interventions at the local, state, and federal level need to be implemented to reduce health and safety risks and promote health, according to Health People 2030.
Sources:
https://health.gov/healthypeople/objectives-and-data/browse-objectives/neighborhood-and-built-environment
https://www.countyhealthrankings.org/explore-health-rankings/pennsylvania/cambria?year=2022
https://www.countyhealthrankings.org/explore-health-rankings/pennsylvania/somerset?year=2022